Telling Accurate Stories

Data are a valuable tool when it comes to storytelling. Yes, they can be used to support a powerful argument, but can also be misrepresented to justify false claims.
Rebeca Pop wants to make sure the students she teaches understand how to turn vast amounts of data into accurate, visually appealing stories.
Pop is an adjunct lecturer in Northwestern Engineering's Master of Science in Machine Learning and Data Science (MLDS) program (formerly the MSiA program). She is in her third year of teaching the program’s Introduction to Data Visualization and Data Storytelling course.
“Data visualization will remain crucial moving forward,” said Pop, who, in addition to her teaching duties, is the founder of data visualization lab Vizlogue and the senior director of marketing analytics for Omnicom Media Group. “It empowers better decision-making by presenting complex data in an intuitive and accessible format.”
But it can also be used to present data in ways that are, at best, misleading.
As an example, she points to a map of the United States that shows the percentage of the country’s land mass that voted for each presidential candidate in 2020. Taken that way, it would appear one of the candidates would have won easily.
Yet that wasn’t the outcome.
“The choropleth map has the advantage of being geographically accurate, but it is ultimately misleading,” she said. “Acres don’t vote. People do.”
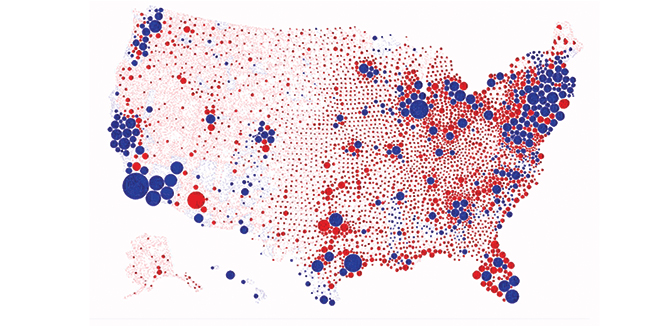
A more accurate map, Pop said, is one that uses the exact same data but shows something more meaningful than red or blue land masses. Rather, this map shows population centers represented by bubbles proportionally sized to reflect the number of votes – red bubbles for Republicans, blue bubbles for Democrats.
“Although the data is similar, the story that each of the two maps tells is contrasting,” she said. “In fact, most large bubbles are blue. The second map paints a much more accurate picture of how Americans voted.”
Pop’s MLDS responsibilities aren’t her only ones at Northwestern. She teaches a similarly themed class in Northwestern Engineering's Master of Science in Information Technology (MSIT) program. The MLDS version is double the length – 10 weeks instead of five – which allows for a deeper dive into data visualization and storytelling topics.
“Once they graduate, MLDS students are expected to work with data and present data to various internal and external stakeholders,” she said. “Data visualization and data storytelling will be a key part of their jobs.”
The students are better prepared to land one of those jobs thanks to an in-class project that asks them to redesign their resumes using the tools and techniques Pop teaches. The assignment pushes students to think visually about their professional histories.
Student feedback about the project has been overwhelmingly positive, she said.
“Some students expressed excitement with how unique their redesigned resumes were and believed it would help them in the job application process,” Pop said. “A more visually appealing resume created in a data visualization tool (such as Tableau) will help the students stand out and hopefully land their dream job.”

