Building Informative and Trustworthy Election Forecasts
Interdisciplinary team aims to bolster trust in US election forecasts through uncertainty visualizations
Eyes on both sides of the aisle are glued to polling data and predictions ahead of the 2024 US presidential election.
And, though the stakes in the outcome are critical, election forecasting is inherently steeped in uncertainty.
Forecasters like 538 and The Economist build statistical models on top of polling data and fundamental demographic, economic, and political indicators to produce probabilistic predictions of election outcomes over time.
On the final day before the 2016 election, for example, 538 simulated the election 20,000 times and forecasted a 71 percent win probability for Hillary Clinton. Such a statistic indicated high uncertainty but was misperceived by many as deterministic. When the actual election revealed Donald Trump as the winner, the misinterpretation of 538’s model produced public skepticism and an erosion of trust in election forecasters.
 In response to the anxiety around the 2016 and 2020 election cycles, Northwestern Engineering’s Matthew Kay and members of his Midwest Uncertainty (MU) Collective team are spearheading multidisciplinary work aimed at bolstering trust in US election forecasts.
“Trust in high-profile election forecasts influences the public’s confidence in the integrity of the electoral system and impacts public sentiment and voter turnout,” said Kay, associate professor of computer science at the McCormick School of Engineering and associate professor of communication studies in Northwestern’s School of Communication. “Seeding trust in election forecasts is a significant challenge.”
Maintaining trust in election forecasts
Drawing upon theories of human perception and uncertainty cognition, Kay and computer science postdoctoral scholar Fumeng Yang investigated uncertainty visualizations that improve people's decision quality and help data analysts communicate uncertainty more effectively.
 “Our approach integrates complex data analysis, innovative design solutions, and comprehensive user studies to ensure that our visualizations are both informative and trustworthy,” said Yang, an incoming assistant professor of computer science at the University of Maryland, College Park. “Through our interdisciplinary research, we aim to create clear, effective, and trustworthy visual tools that empower citizens to engage knowledgeably with electoral information.”
In one study, Kay and Yang developed a sequential decision-making experiment involving a hypothetical 2028 US presidential election to gauge how different presentations of forecasts and outcomes affect people’s trust. The work earned a Best Paper Award at the 2024 ACM CHI Conference on Human Factors in Computing Systems in May.
In the study, participants completed 10 simulated election cycles with different win probabilities and forecast outcomes — eight correct and two incorrect forecasts. For each cycle, users navigated a professional website interface featuring one of four different uncertainty visualizations conveying state and electoral college forecasts — a quantile dotplot, an animated Plinko-style quantile dotplot, a histogram interval, and text. Each representation incorporated extensive annotations to aid interpretation.
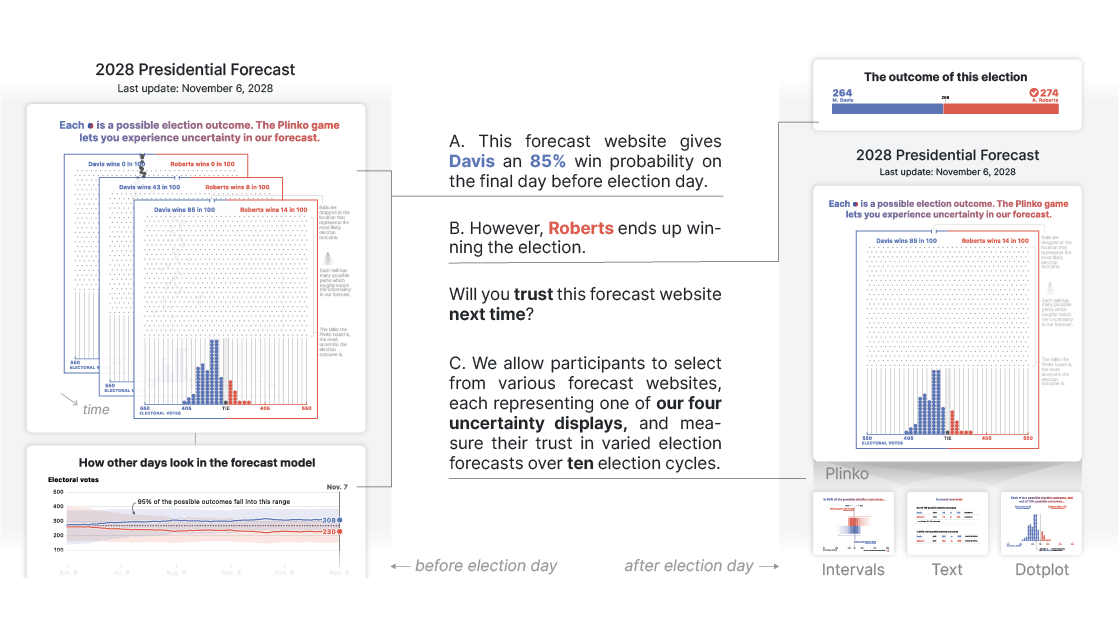

Following each simulated election outcome, participants assessed the accuracy, reliability, and overall trustworthiness of the forecast website. Next, they selected the uncertainty visualization format they preferred for the next election cycle, allowing researchers to gain insights into both perceptions of the forecast website (attitudinal trust) and actions reflecting user preferences (behavioral trust).
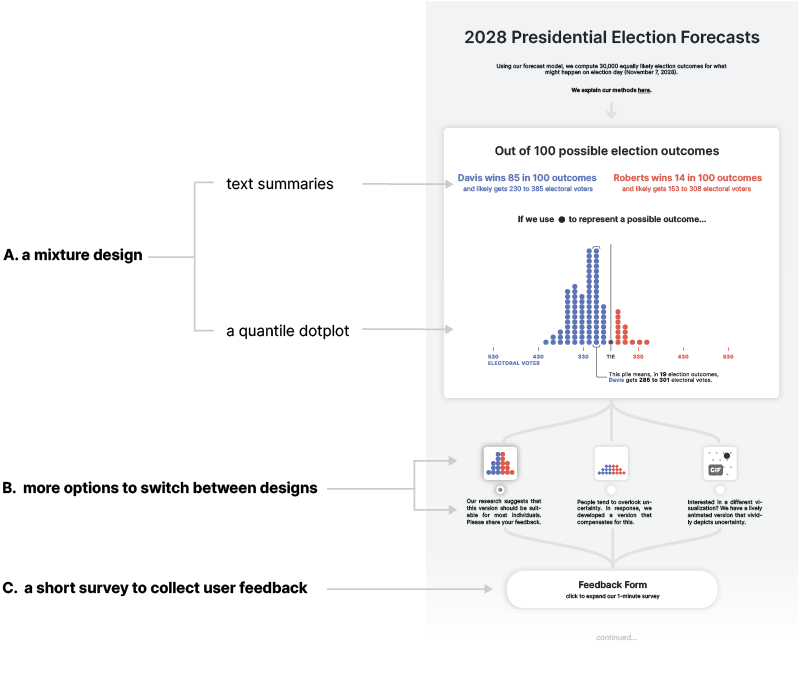
The research team learned that text summaries and quantile dotplots maintain the highest trust over time in repeated election cycles with observable preferential differences based on partisanship and educational attainment. Aiming to engender the highest trust among most viewers, they recommended a combined layout comparable to 538’s 2020 and 2022 forecast presentations.
“Our qualitative results highlight the need for forecast presentations to prioritize understandability, readability, clarity, and accuracy, Kay said. “The partisanship and educational background of viewers may significantly influence their trust and preferences. Forecasters might consider simplifying the interface to cater to a broader audience.”
Uncertainty visualization of election forecasts
Kay and Yang’s study was built upon a previous study exploring forecast visualizations in the 2022 US midterm elections.
In that paper, which earned a Best Paper Award at IEEE VIS 2023, an interdisciplinary team including Kay, Yang, and eight Northwestern researchers from Northwestern Engineering, School of Communication, and Weinberg College of Arts and Sciences presented a longitudinal, large-scale, real-time study on the impact of uncertainty visualization of election forecasts in the US 2022 midterms.
Using Bayesian multilevel modeling and post-stratification to produce demographically representative estimates, the researchers found that different election forecast visualizations can heighten emotions, increase trust, and slightly affect people's intentions to participate in elections to different degrees. Their qualitative analysis uncovered the complex political and social contexts of election forecast visualizations, underscoring that visualizations may provoke polarization.
 “Forecasting a presidential election presents a minefield of technical and social challenges. Yet these forecasts are often in demand leading up to an election,” said Jessica Hullman, a co-author on the study and Ginni Rometty Professor and associate professor of computer science at the McCormick School of Engineering, who also co-leads the MU Collective with Kay.
“While we can’t conclude from these studies how a forecast impacts behavior over not using one, it appears that how one presents a probabilistic forecast can impact feelings of trust,” Hullman continued. “This corroborates results of uncertainty visualization studies from other domains and has obvious design implications.”
Additional study collaborators included Nicholas Diakopoulos, professor of communication studies and (by courtesy) professor of computer science in Northwestern Engineering; Steven Franconeri, professor of psychology at Weinberg and (by courtesy) professor of computer science; and Erik Nisbet, Owen L. Coon Endowed Professor of Policy Analysis and Communication.
Visualizing vote counting
As voting sites close on election day, the public’s focus will shift from election forecasts to vote counts and electoral race calls.
 Leading up to the November elections, Technology and Social Behavior PhD student Mandi Cai and rising fourth-year computer science and art student Grace Wang are investigating public perceptions around the use of data and statistical modeling in election coverage, with a particular focus on the communication of live election results.
Prior to joining Northwestern, Cai was a data journalist at The Texas Tribune. Her award-winning work with editors Darla Cameron and Chris Essig inspired Cai’s curiosity about data visualizations in the media and shaped her current research focus. Wang leverages her interdisciplinary background in computer science and design to develop innovative systems that enhance the user's cognitive engagement.
After running a series of interviews to determine participants’ baseline levels of understanding, confusion, and distrust toward winner projections in US elections, Cai, Wang, and Kay will design and test alternative interface designs to convey live election results during the 2024 general election.
The team aims to improve user understanding of vote processing and counting procedures as well as winner projections published while votes are still being counted in order to synthesize techniques for newsrooms to effectively communicate data-driven models.
“Ultimately, I wish to empower data journalists to be data educators who can consider the unique needs of their reader populations,” Cai said. “I also seek to empower readers to understand data they encounter in everyday life, like during elections.”